Comparison Periods
Graphs and stats on the 1st version of the office dashboard show a “current” and “previous”, the current is the last 28 days, the previous being the 28 days before that. The top right corner will show the current period.
Metrics are refreshed at midnight in the primary timezone of the region (eg, Melbourne time for Australia, Detroit time for America, London time for UK).
Individual Stats:
Payments Volume
Payments volume is the sum of the item total across the period, the item total is the sum of the items in the cart before any discounts or credits are applied. This metric does not include refunded orders, or orders that have not been marked as complete.
This metric is tax inclusive in all regions.
Payments Count
Payments count is the total count of payments over the period, a payment will include orders that are $0 or paid entirely with credit.
Payments Average Volume (ATV)
This is the average item total per payment, it could be calculated as the payment volume divided by the payment count. This metric is calculated from the Item Total (see Payments Volume above for more information), for example 2 orders in a period, both $10, one was paid with credit and the other was paid by credit card, the average volume will be $10 not $5.
Customer Frequency
This is the average amount of visits a customer has made to any organisation. A visit is defined as any amount of orders within a 3 hour period.
Examples of visits:
-
Ordering a round of drinks at 11AM, followed by a meal at 12PM will be a single visit.
-
Ordering a coffee at 8AM, then ordering a sandwich at 12:30PM will be two visits.
-
Ordering a juice at location 1 at 9AM, then a bagel at location 2 at 11:30AM will be one visit.
Only customers who ordered within the period will be counted towards this metric, for example if an organisation has 100 customers but only 50 of them have placed orders in the last 28 days, with 25 of those people making 2 visits, the average frequency will be 1.5 (75 orders placed by 50 customers, 75 / 50 = 1.5).
Charts
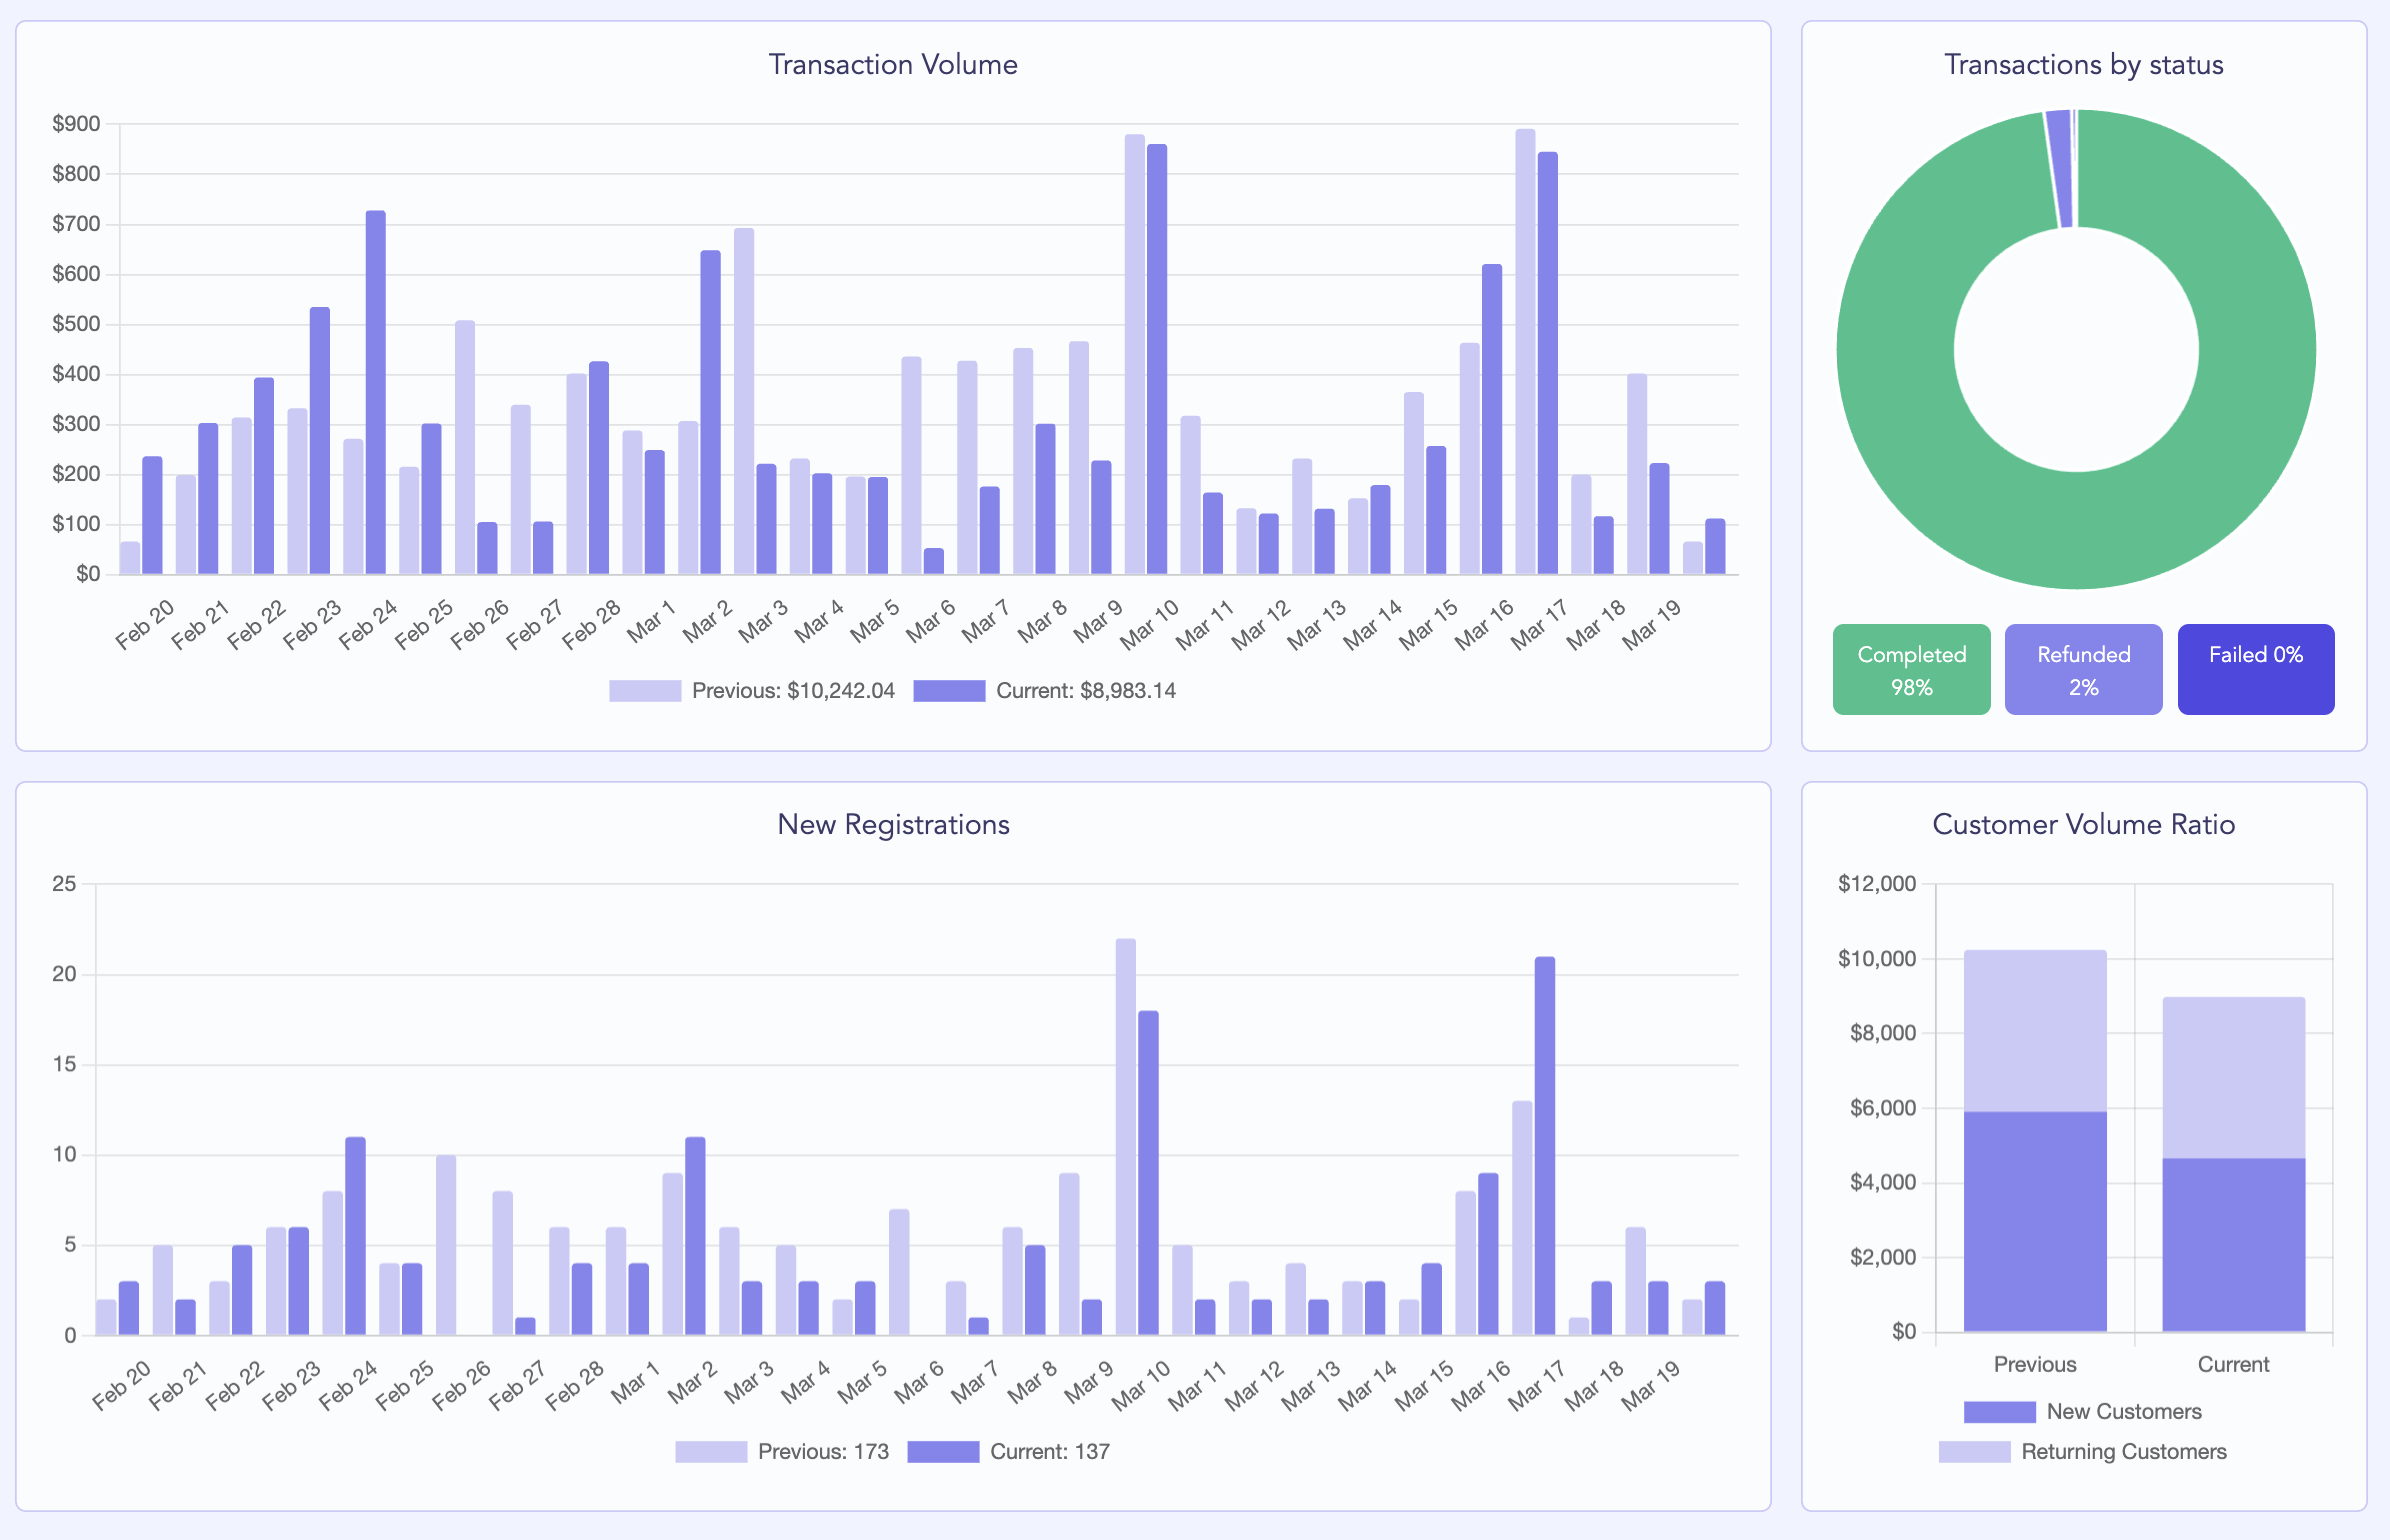
Payment Volume
This is a graph of the item total over the last 28 days, the darker purple is the current period, the lighter purple is the previous period. (see Comparison Periods and Payments Volume).
Payments By Status
This chart shows a breakdown of all payments (“orders” in Aston) by their status. The statuses are broken down as:
Refunded
The payment has been fully refunded either automatically due to a lack of confirmation from the POS, or via a manual refund within office/operator. Partial refunds via Stripe are not shown in this metric.
Failed
Likely caused by POS errors or outages, these are orders that were completed by the customer but could not be placed to the POS or suffered an internal error within LOKE infrastructure.
Completed
These are orders that have been paid for and marked as completed by the POS, while it is possible for problems to occur to orders that are completed these problems are typically outside the scope of what LOKE can control.
New Registrations Count
This chart breaks down customer accounts created over the period. It shows a comparison in the same way as the Payment Volume chart.
This chart does not filter customers by any criteria beyond registering for an account, so it will include customers that register without making a purchase.
Customer Volume
This chart breaks down payment volume by the date of account creation. Accounts created within the same period as a payment will be counted towards “New Customer Volume”, with returning customers being the remainder.
Example:
The dashboard is being viewed on January 27th, customer 1 has signed up on January 1st, spent $100 immediately, and then visited twice more on the 11th and 16th spending another $200, new customer volume will be +$300 for that period.
However, viewing that dashboard in February 5th will show $0 for new customer volume, and the previous period will show $200.